A Friendlier Alternative to starlink-grpc-tools
If you've found starlink-grpc-tools and want the same local telemetry without building your own monitoring stack, the short answer is: yes, there's a friendlier route. starlink-grpc-tools is excellent and free, but it's a set of scripts you assemble into a system, not an app you run. Nexus Telemetry gives you the same underlying data in a desktop application with the charts, history, and alerts already built. This guide explains the trade-off honestly so you can pick the right one.
Both read from exactly the same place: the dish's local gRPC interface. The difference is entirely in how much you build yourself.
What starlink-grpc-tools actually is
It's an open-source project that queries the dish's local gRPC endpoint and outputs the data. At its simplest, a single script prints the readings as text, CSV, or JSON, so you can get numbers out with no database at all. To turn that into a live dashboard, the common path pairs it with a time-series database (InfluxDB) and a dashboard (Grafana), at which point you're running and maintaining several pieces: the scripts, a database, a dashboard, and the glue between them. There's an official Docker image that eases the setup, but assembling and running the full stack is still yours to do.
For the right person, this is great. It's free, it's flexible, you control every part, and if you enjoy building and maintaining your own monitoring stack it's a genuinely capable solution. Plenty of people run it happily.
Where it gets in the way
The cost is your time and the setup. If you want more than raw numbers in a terminal, you need to be comfortable on a command line, stand up and maintain a database and dashboard, and keep the stack current as the dish's API shifts over time. The project itself is actively and capably maintained, and recent versions are built to degrade gracefully rather than crash when Starlink changes a field, so you're largely insulated from the churn. But it's still a system you run and look after, not a thing you install and forget. There's also no native interface; the dashboard is something you build out of Grafana panels.
If you wanted telemetry but didn't want a side project, that's friction rather than fun.
What a desktop app does instead
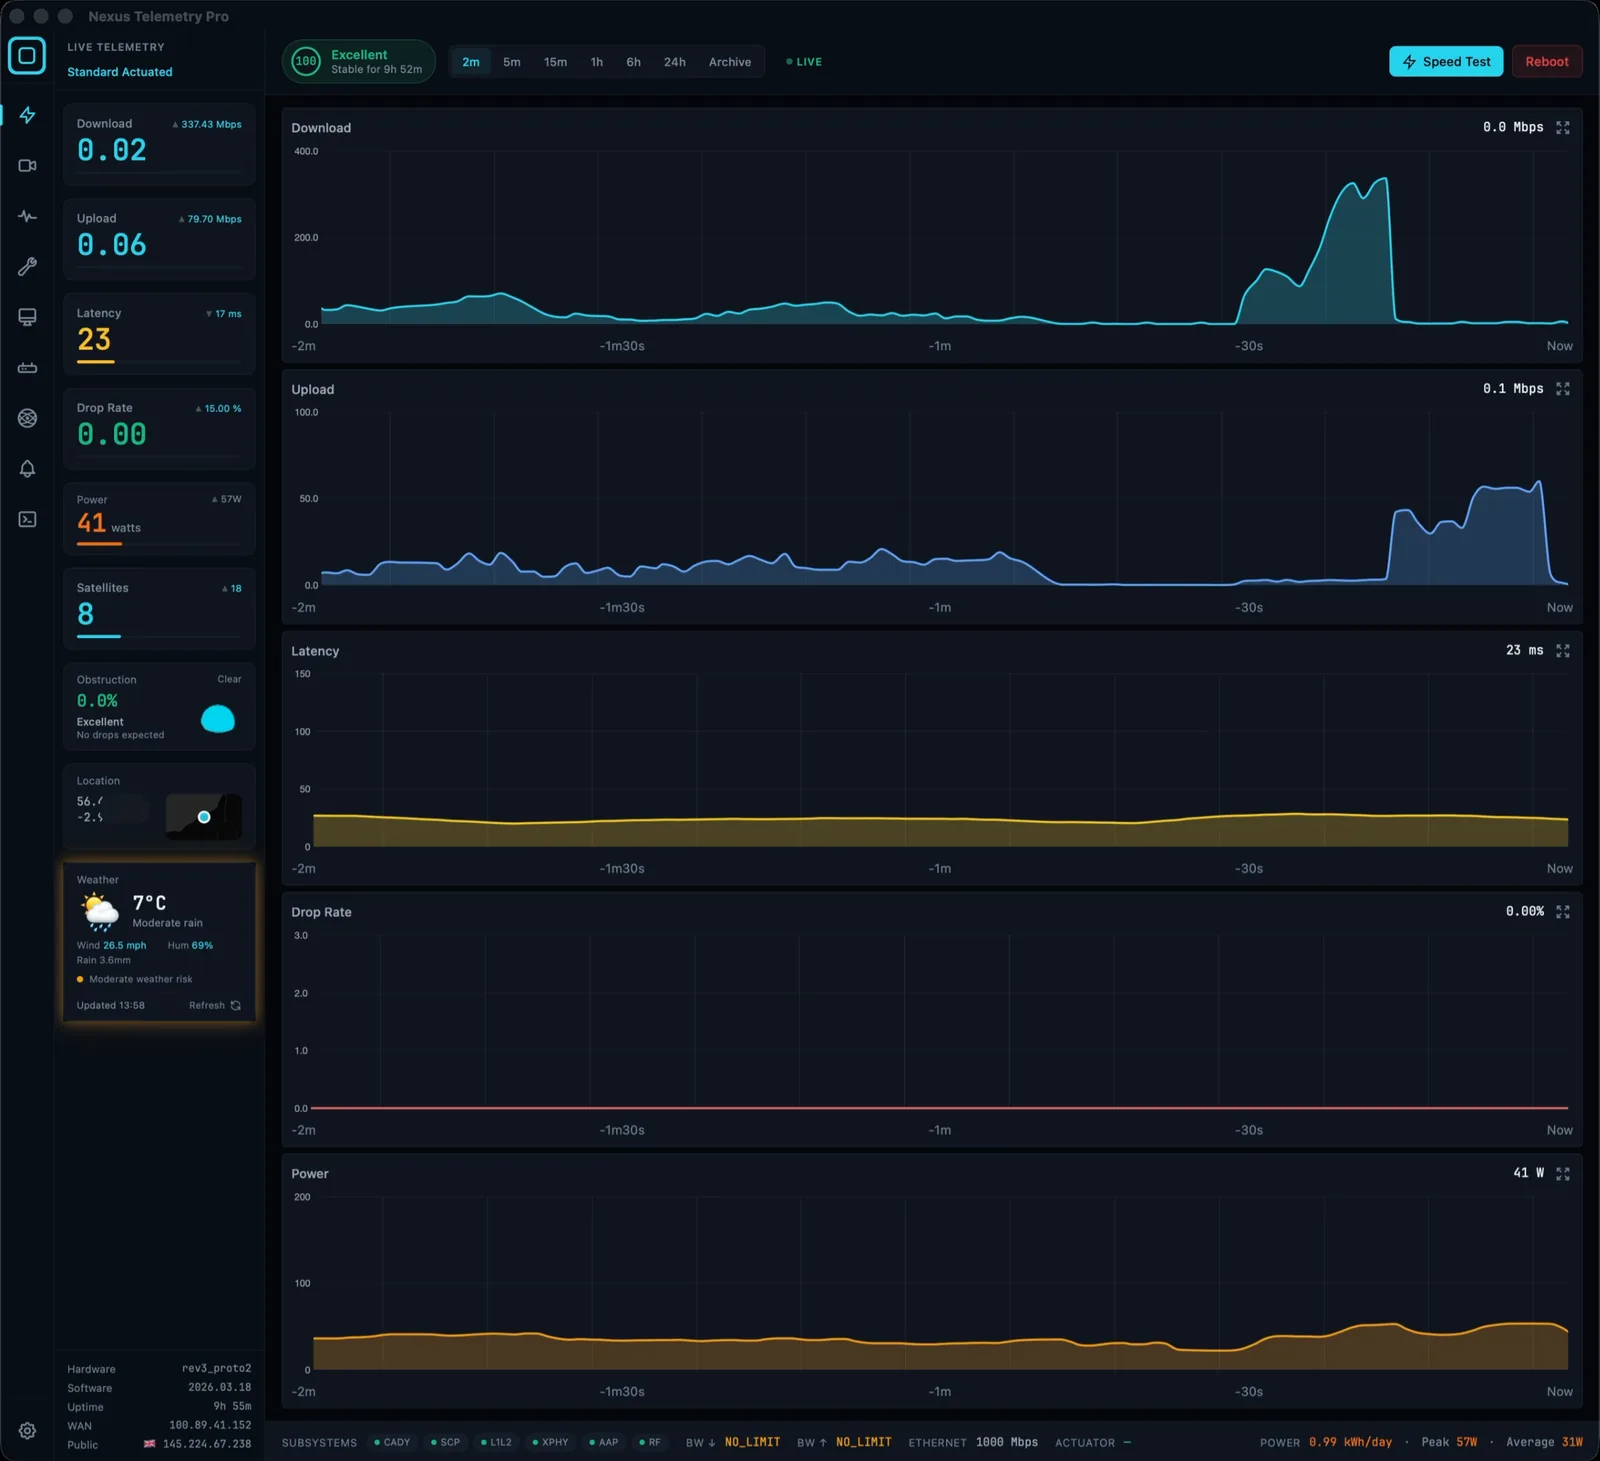
Nexus Telemetry reads the same local gRPC data, but presents it as a finished native application for macOS, Windows, and Linux. There's no database to run, no dashboard to build, no glue to maintain. You launch it on the same network as your dish and it shows live telemetry, recorded history, obstruction maps, latency and drop charts, power draw, alignment, and alerts, immediately.
It runs entirely on your own machine, with no account and no cloud relay, the same local-first principle that draws people to grpc-tools in the first place. The difference is that the interface, storage, and charting are done for you.
Which should you choose?
Choose starlink-grpc-tools if you want maximum control, enjoy building and maintaining your own stack, want to integrate the raw data into a larger custom system, and your time on it is part of the appeal. It's free and powerful.
Choose a desktop app like Nexus Telemetry if you want the same data without the build, prefer a native interface to a Grafana you maintain, and would rather spend your time reading the telemetry than assembling the pipeline. There's a free trial, so you can see your own dish's data in a minute and decide.
Neither is wrong. They serve different people, and the honest framing is build-it-yourself versus ready-made, not better versus worse.
The short version
starlink-grpc-tools and Nexus Telemetry read the same local data from your dish. grpc-tools is a free, flexible, build-it-yourself stack for people who enjoy that; Nexus Telemetry is a ready-made desktop app that gives you the charts, history, and alerts without assembling a database and dashboard. Pick based on whether you want a project or a product.
See the same telemetry without the setup with a free trial of Nexus Telemetry.