How to Verify a Starlink Installation
A verified Starlink installation shows four things: 0% obstruction, stable latency to the Starlink point of presence (typically 20 to 40 ms), a drop rate at or near zero outside satellite handovers, and a quiet event log. A 20 to 30 minute soak test settles the latency, drop rate, and event log; obstruction is confirmed with the app when you mount and by the dish's own map over the following day. The official app shows some of these but records none of them, so it leaves nothing to hand over or compare against later. Here is how to check each one, and how to leave the customer with a report instead of a reassurance.
This guide is written for professional installers, marine electricians, and field engineers, but the checks are the same if you are commissioning your own dish.
Why isn't "Online" in the app enough?
The app confirms the dish is connected and can run a speed test, but a green "Online" says nothing about mount quality. A dish can show a green tick while logging brief outages every few minutes from an obstruction the eye cannot see, and the app keeps no record you can hand over or compare against later. Most return visits are not faults, they are disputes about what "working properly" meant on day one. A recorded baseline ends those disputes before they start.
What does a good installation look like?
Check the numbers against these before you accept them. Obstruction should be at or very close to 0%, with the dish reporting no drops expected. Idle latency to the Starlink point of presence should sit around 20 to 40 ms; pings to real internet destinations run higher, often into the 40s or 50s, which is normal and not a fault. Drop rate should be zero outside momentary satellite handovers, which appear as sub-second blips and are normal. Power draw varies by dish generation and weather, so look for a steady figure rather than a specific number. Anything persistently outside these ranges is worth solving from the ladder, not from a return visit.
How do you check for obstruction before fixing the mount?
Check obstruction with the app before you fix the mount, holding the phone at the dish's height, exactly as in the survey. The dish then builds its own obstruction map from what it actually sees. Current firmware draws a first map within about an hour, so you get an early read before you leave site, but the map keeps settling over the first day and the authoritative check is still the next-day reading rather than anything in the soak. Either way you are looking for 0% and a clean field. A chimney, tree line, or rigging that clips the field of view shows up there long before the customer notices Tuesday evening dropouts. This deserves its own walkthrough, so we wrote one.
How to do a Starlink site survey →
What should you test during commissioning?
Record the whole commissioning period as a session. In Nexus Telemetry Pro, start a recording, name it after the job, and carry on working. The session captures every metric at one-second resolution, and 20 to 30 minutes alongside your other work is enough for a meaningful baseline. Run these checks while it records.
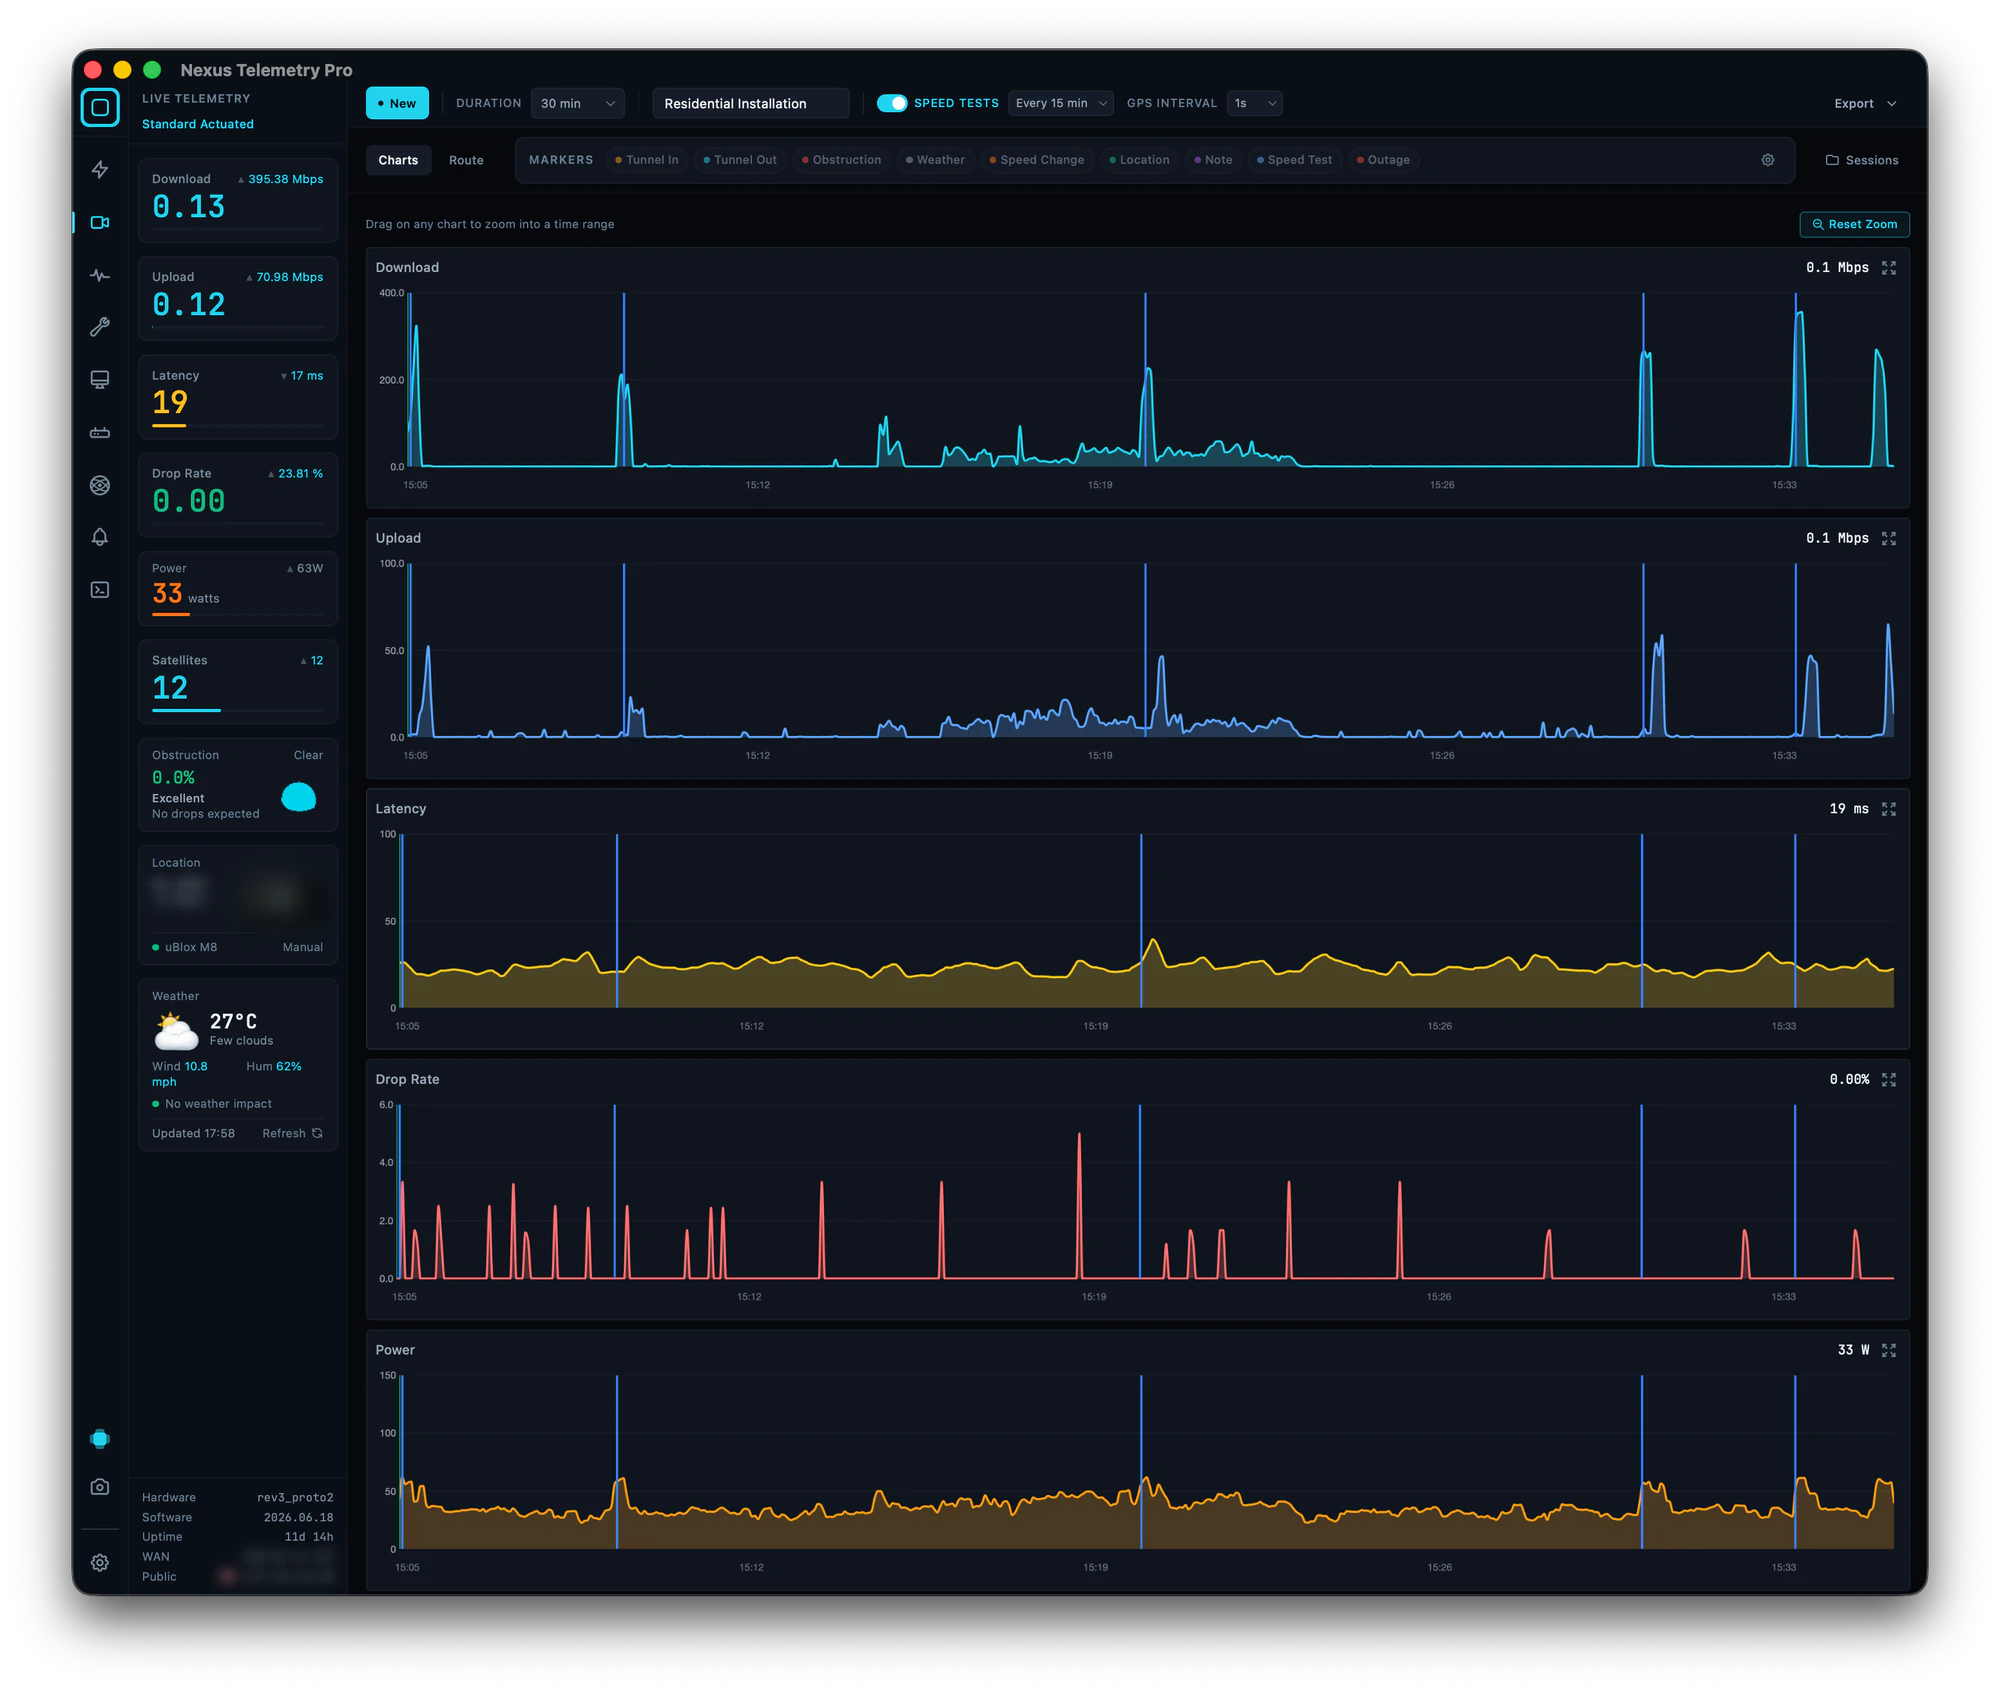
Speed tests. Run two or three across the session, either triggered manually or on a schedule the session runs for you. Each is logged with a timestamp, and they are averaged in the final report.
Latency to real destinations. One ping to one server proves little. The ping matrix tests dozens of real targets across regions at once, CDNs, game servers, and DNS providers, and summarises reachability and best latency per region. For a customer who games or video-calls, this turns "it should be fine" into a number.
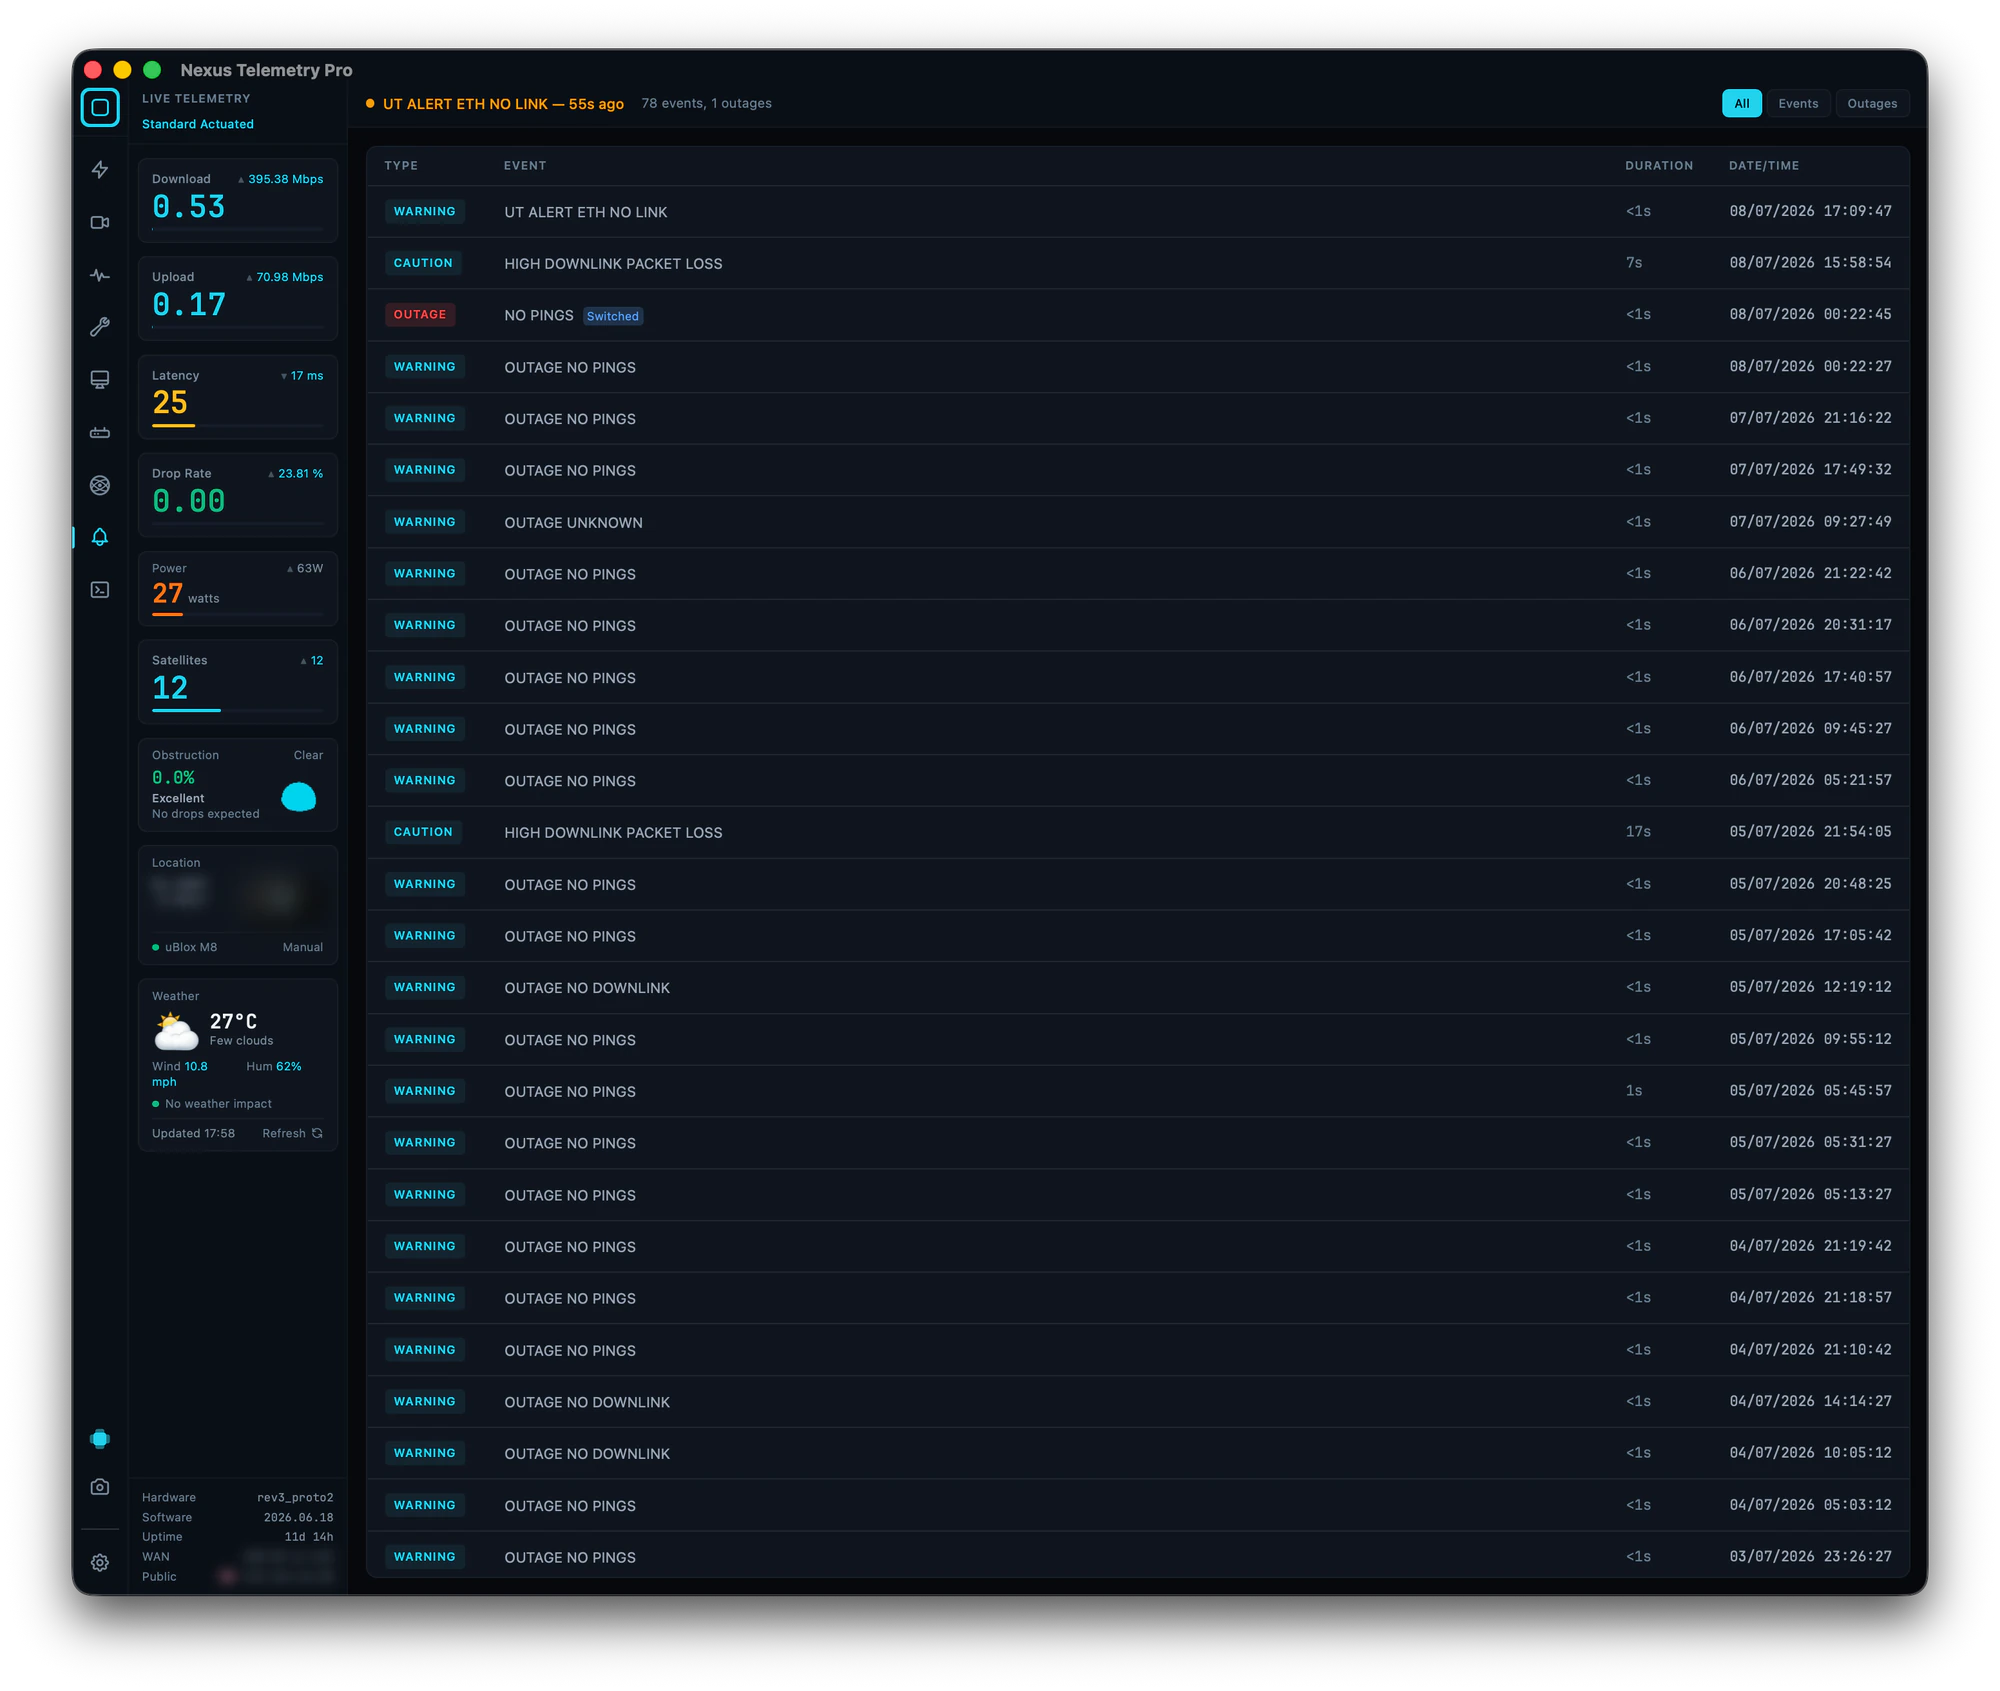
The event log. While you work, the alert log records every outage, warning, and advisory the dish reports, each with a duration and timestamp. A healthy install shows a quiet log for the whole soak. A log full of sub-second no-downlink events points to an obstruction or alignment problem to solve before handover.
Markers. Mark the moments that matter: each speed test, an obstruction demonstration for the customer, a reposition. They appear in the report timeline with timestamps.
How do you tell a dish problem from a Wi-Fi problem?
Run the same ping from two places at once. The diagnostics in Pro send a ping from your laptop and, in parallel, through the Starlink router's own API, and show the results side by side. If the router-side result is clean and the laptop-side is not, the problem is in the customer's network, not your installation, and you can demonstrate that on the spot. This one check prevents more disputed return visits than any other, and it has a full guide of its own.
Is it Starlink or the Wi-Fi? →
What do you hand the customer?
Stop the session and export a PDF report. It opens with an executive summary: average and peak download, upload, latency, drop rate, power, and satellite count, plus uptime and outage totals. Behind that sit the full performance charts, the equipment details, the event log with your markers, the speed test table, and the network diagnostics summarised by region. It is a professionally presented, timestamped, self-contained document. Email it, attach it to the job sheet, keep it on file. When a query arrives in six months, you compare against the baseline instead of arguing from memory.
What about mobile and marine installations?
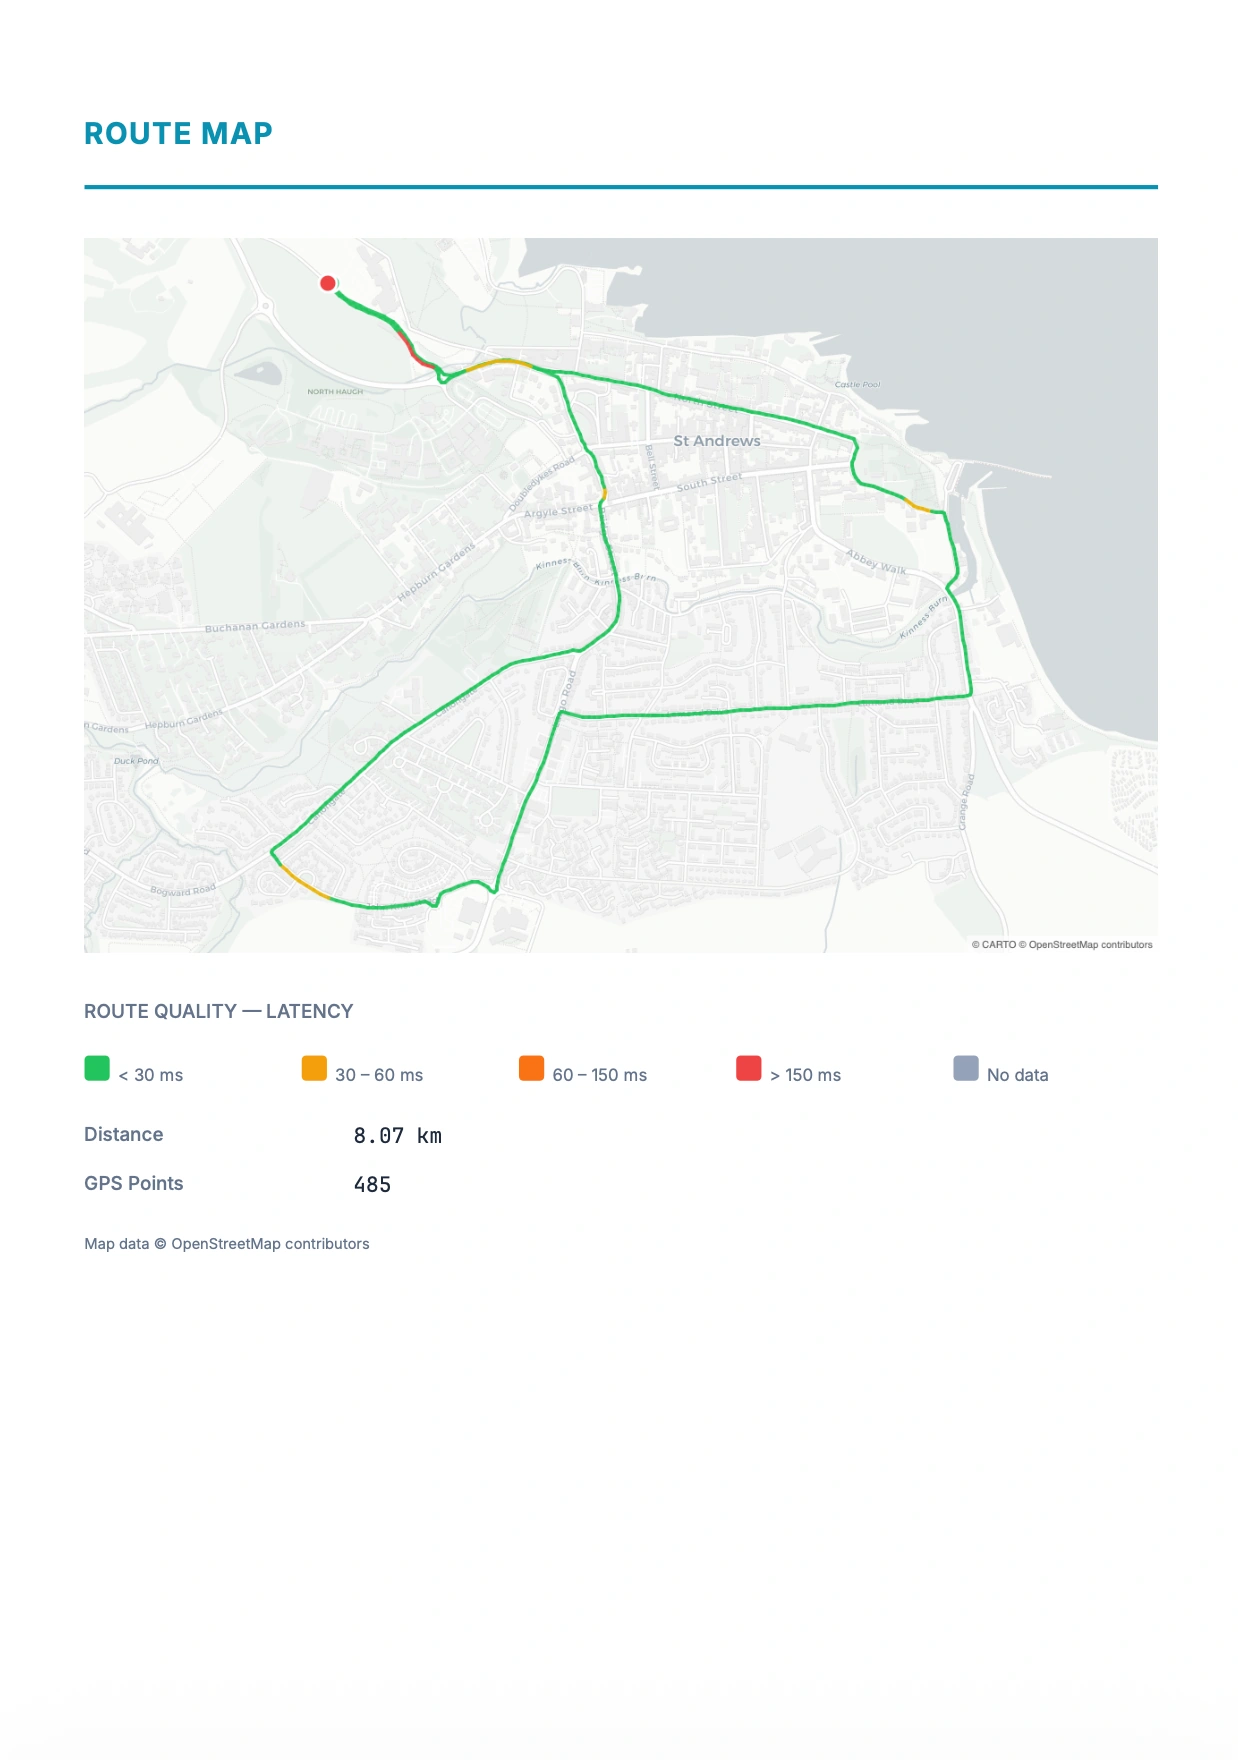
The report includes a route map for moving installs, with the track coloured by latency. A sea trial or drive test becomes one page showing exactly where the connection held and where it strained. We tested this ourselves with a Starlink Mini around St Andrews: seventeen minutes of recording, 948 data points, and an 8 km route map, green where the connection held. A commissioning trial that ends with a green route map is a persuasive document to leave with a skipper.
The short version
Record a 20 to 30 minute session while you commission: run two or three speed tests, watch the event log stay quiet, and use the dual-path ping to separate dish problems from LAN problems. Confirm obstruction with the app before you fix the mount, and from the dish's own map the next day once it has settled. Export the PDF and hand it over. Proof, not promises.
Part of Starlink for Installers and Professionals. Nexus Telemetry is built by Liquidbinary Ltd, the team behind one of the first Starlink Enterprise management platforms. Pro runs natively on Windows, macOS, and Linux with a free trial.