Is It Starlink or the Wi-Fi? How to Diagnose a Fault
The fastest way to settle it is to run the same test from two places at once: from the affected device, and directly through the Starlink router's own API. If the router-side result is clean and the device-side is not, the fault is in the local network, not the dish or the satellite link. That one comparison resolves most "Starlink is slow" complaints, and this guide walks through it plus the checks that follow when the dish really is the problem.
This is written for installers and engineers handling a fault report, but it works the same for diagnosing your own connection.
Why do most Starlink complaints turn out to be Wi-Fi?
Because the customer experiences one thing, "the internet", and the weakest link in most homes and vessels is the last ten metres of it. Distant rooms, thick walls, congested 2.4 GHz, a powerline adapter having a bad day: all of it presents as "Starlink is slow". The dish gets the blame because it is the visible new thing. Before touching a ladder, prove which side of the router the problem lives on.
How do you run the two-path test?
In Nexus Telemetry Pro, open the diagnostics and run a ping to a stable target such as 8.8.8.8. Pro runs it twice in parallel: once from the machine you are on, and once through the Starlink router's API, so the router itself reports its own path to the same target. The results sit side by side.
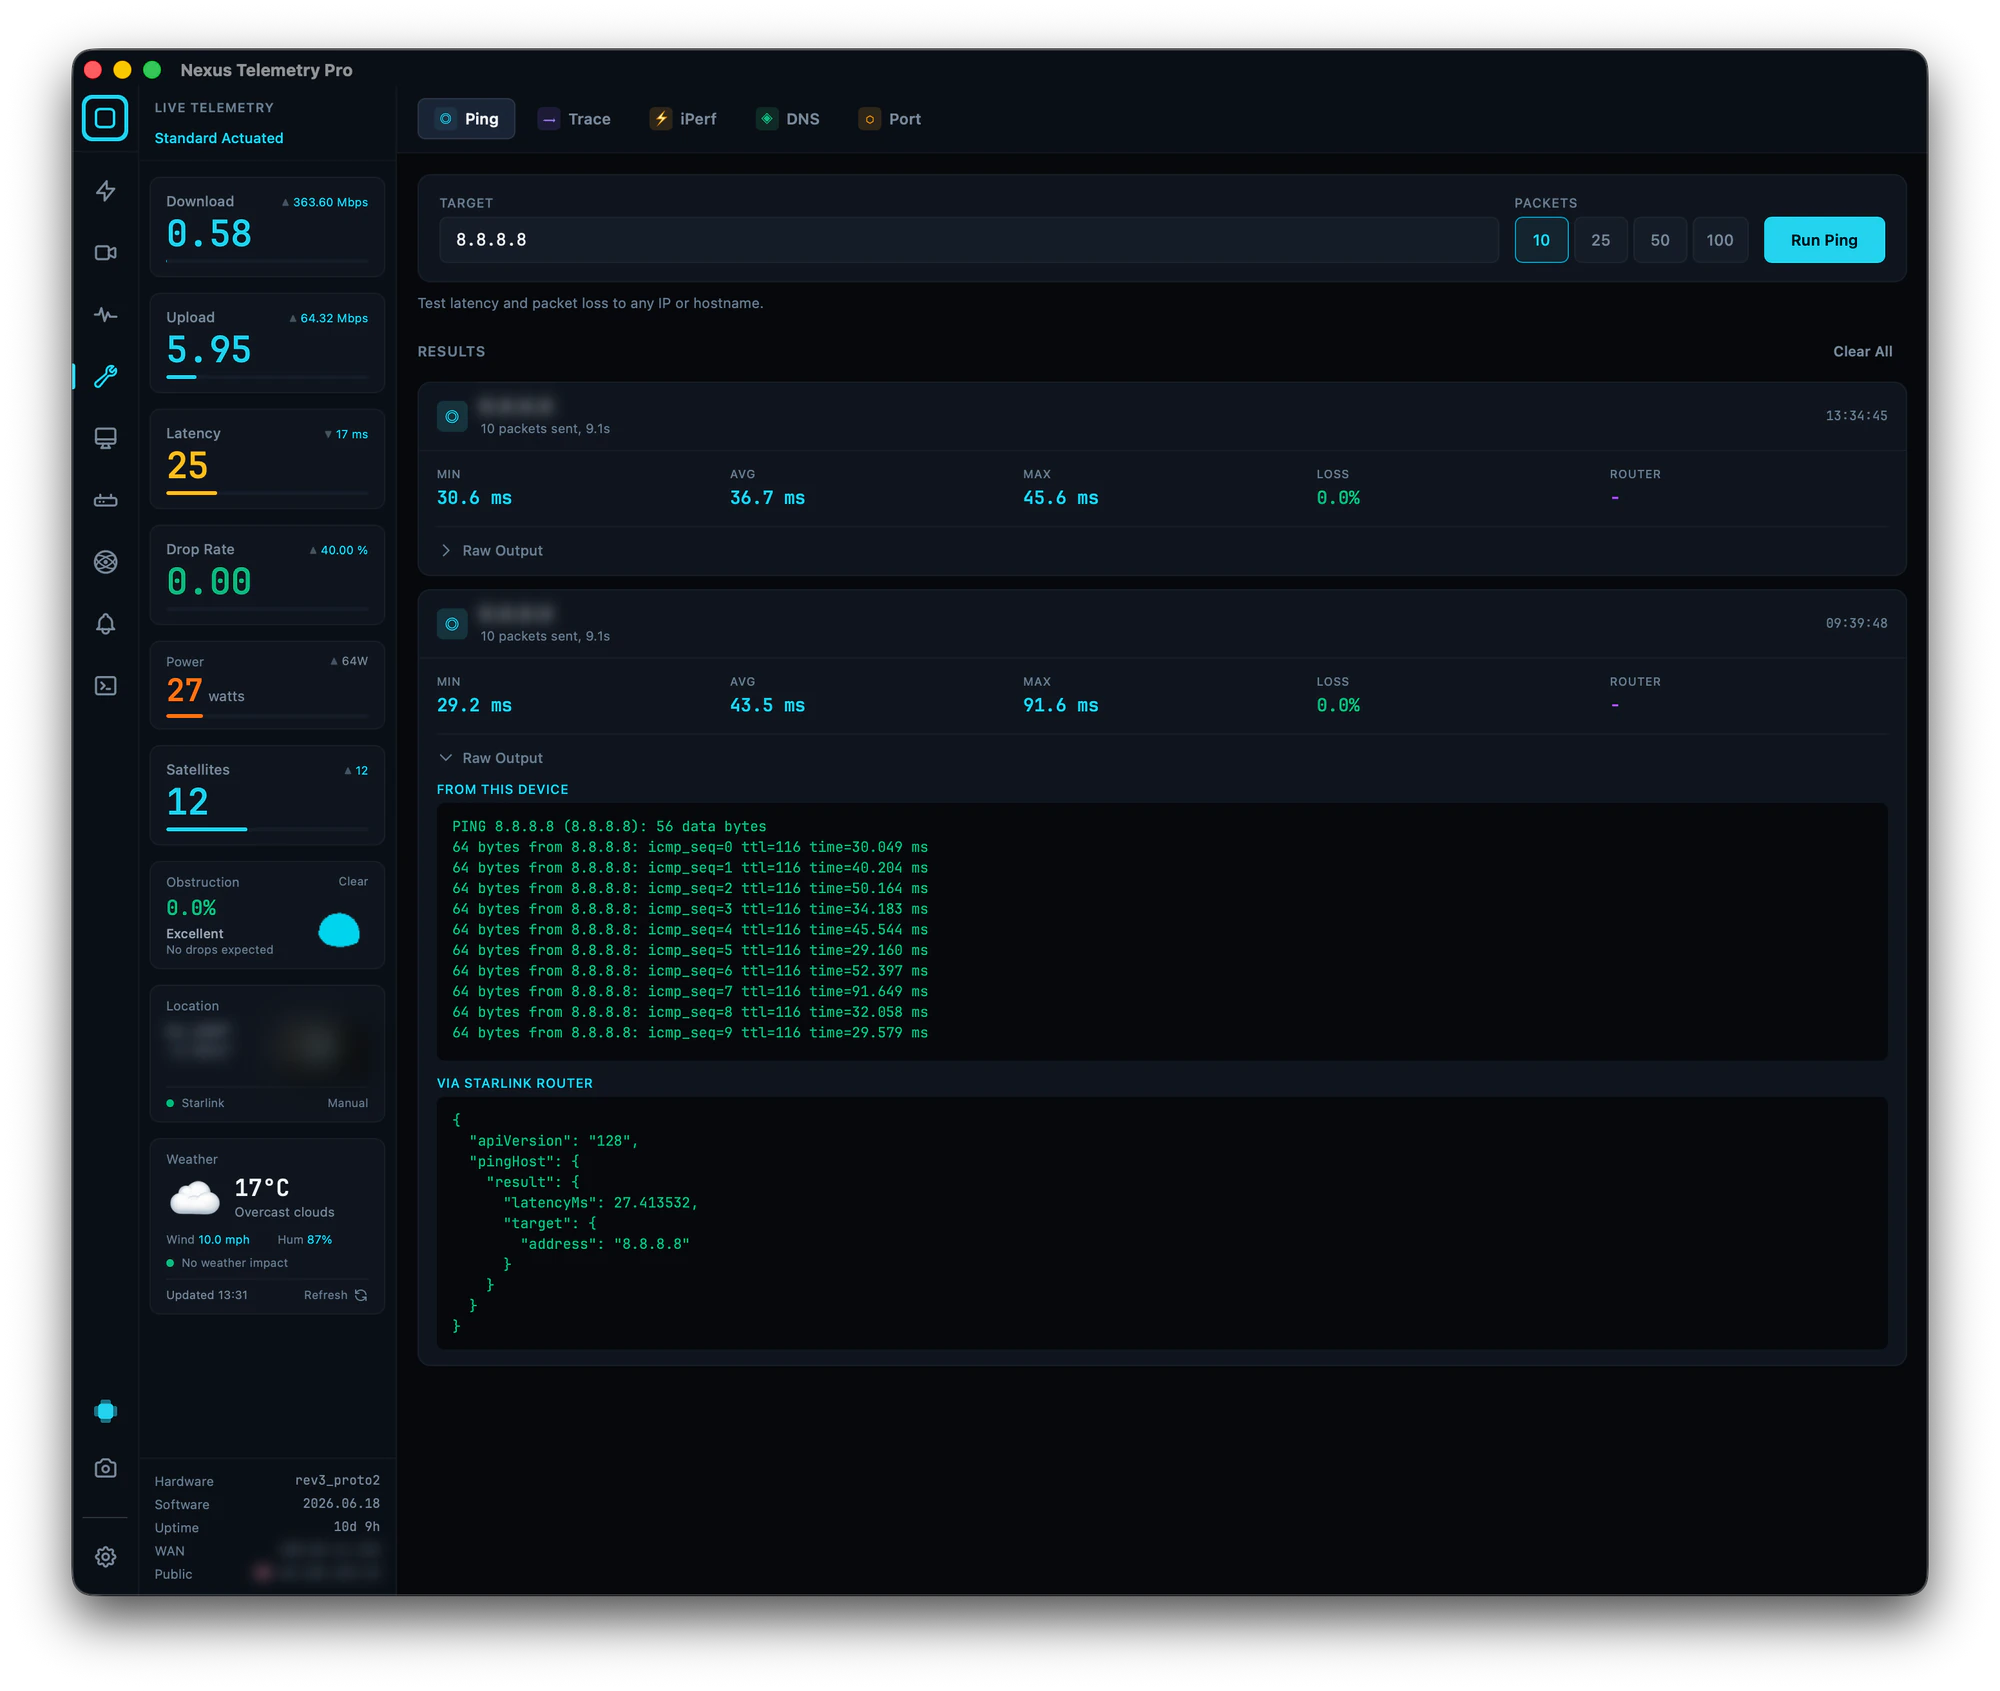
Read it like this. If both are clean, the connection is healthy end to end and the complaint needs narrowing (a specific service, a specific time of day). If the router side is clean and the device side shows loss or high latency, the fault is between the device and the router: Wi-Fi coverage, interference, or local network equipment. If both sides show the same loss or latency, the problem is genuinely upstream, at the dish or the satellite link, and you move to the dish checks below.
What do you check when it really is the dish?
Three places, in order.
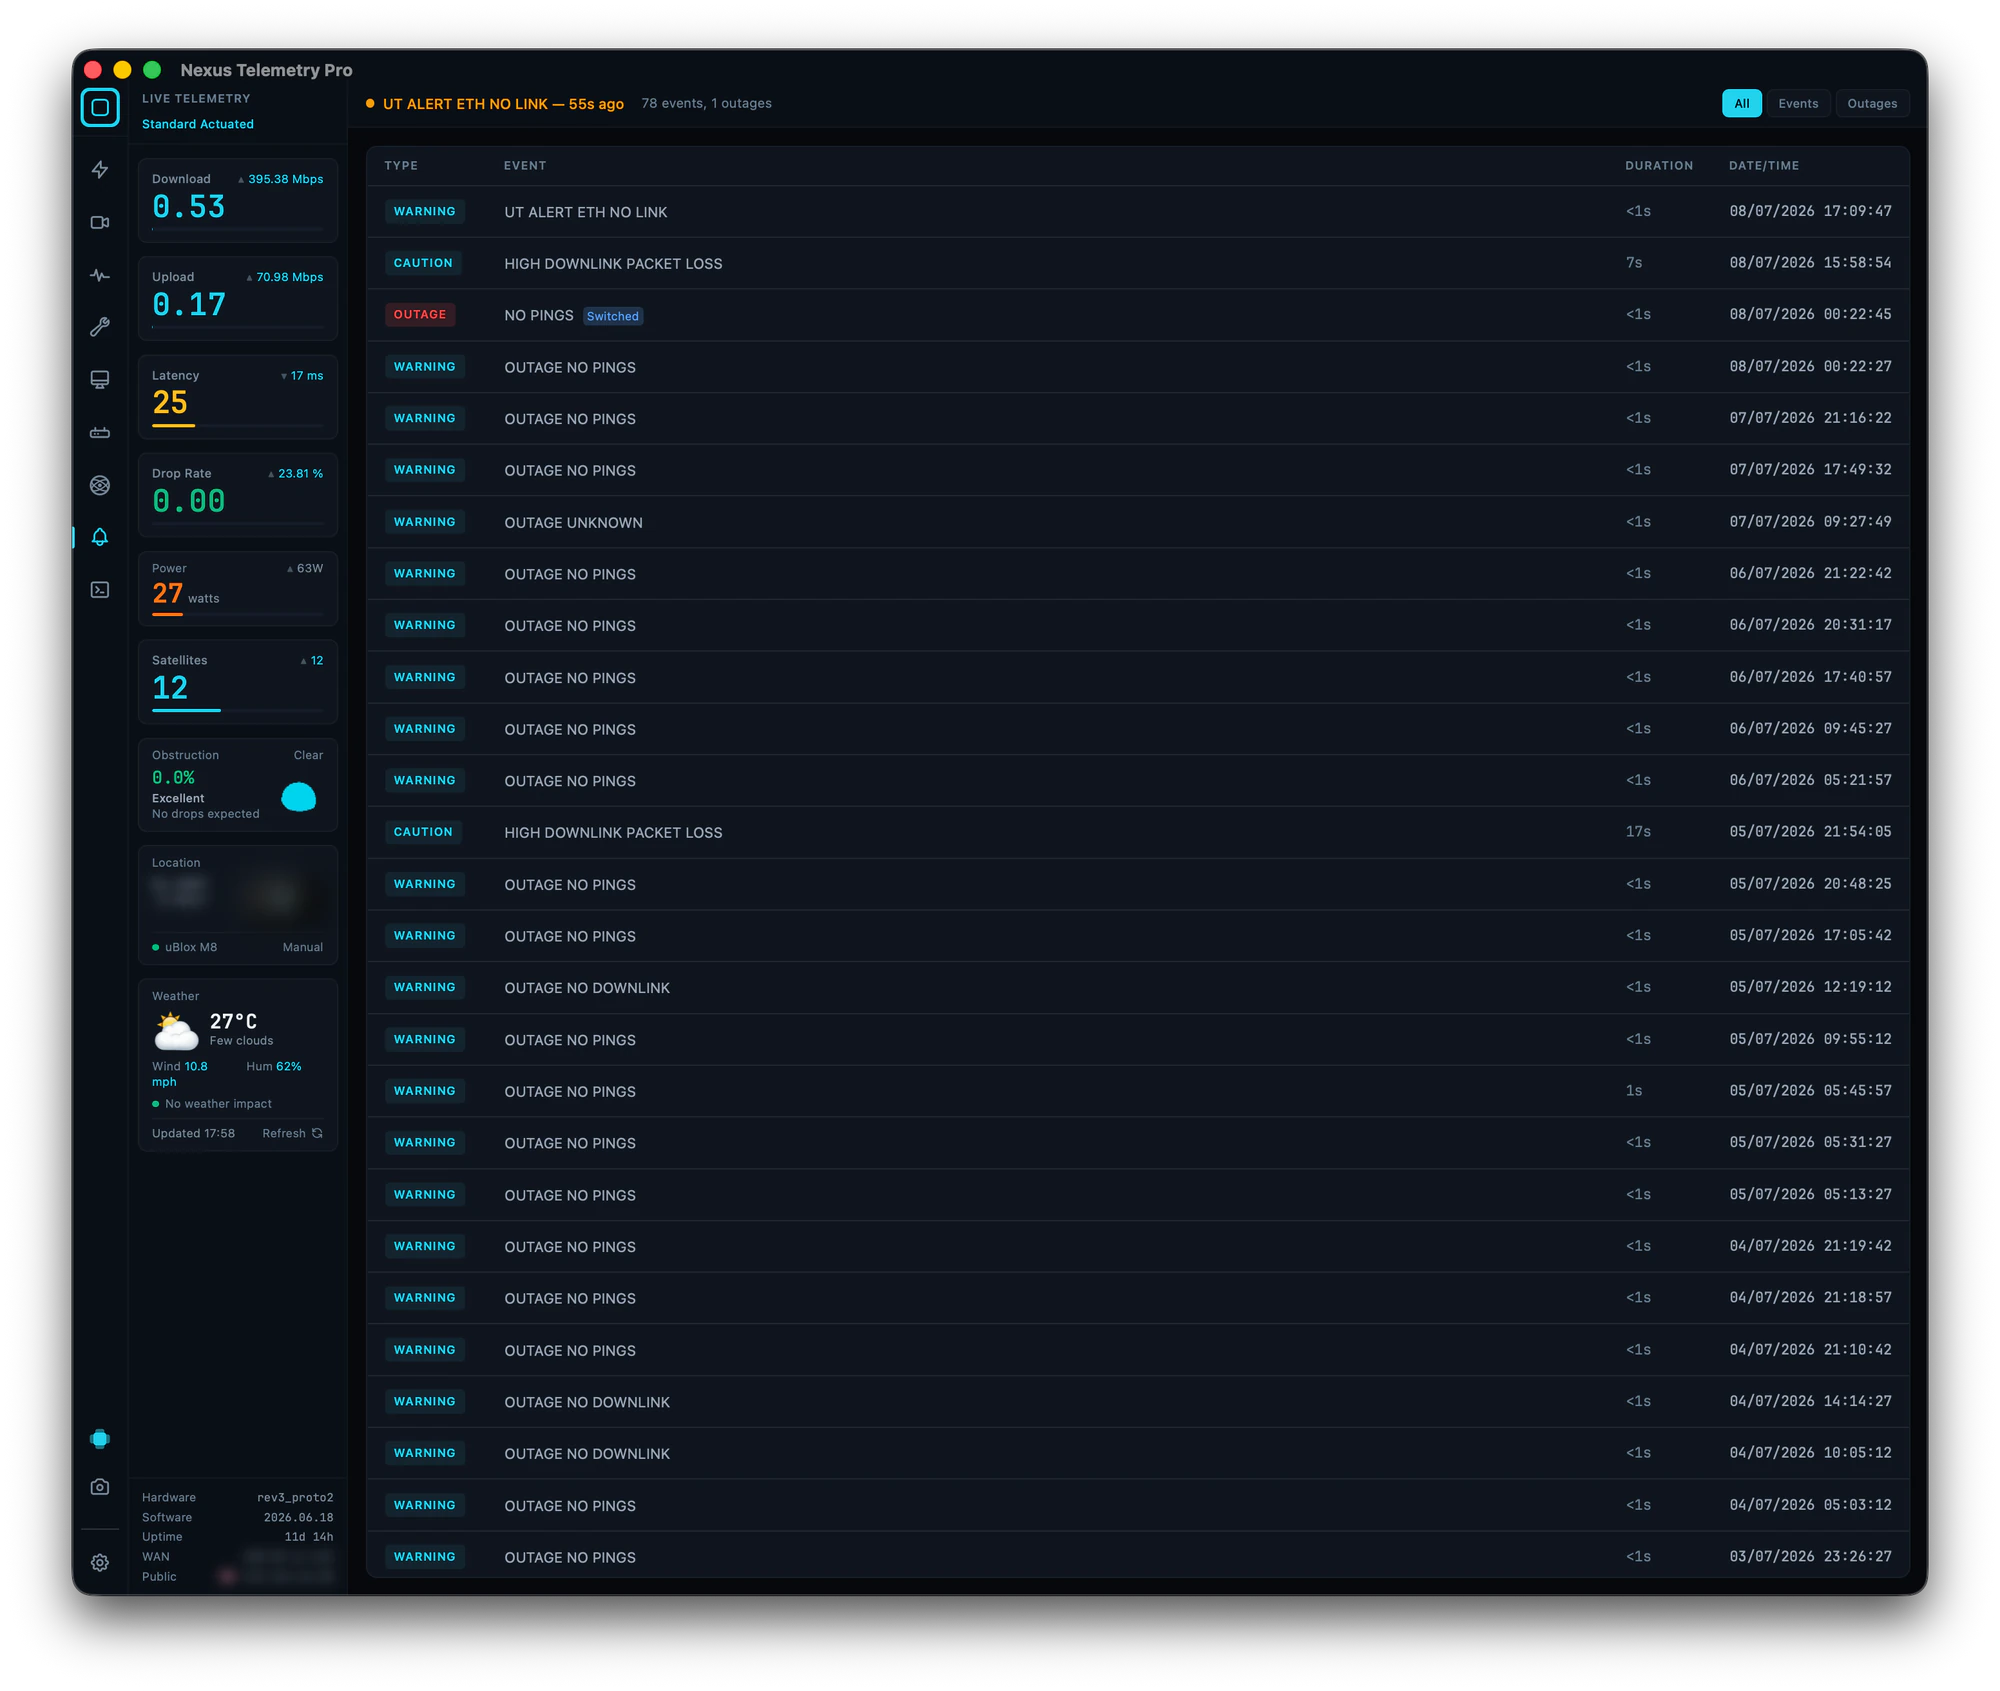
The event log. The dish records every outage and event with a duration and timestamp, each tagged by cause or severity: no-downlink events, ping failures, obstruction outages, and rain-fade advisories among them. The pattern is the diagnosis. Clusters of sub-second no-downlink events point to obstruction. Occasional longer outages with a "switched" flag are network-side. A log that goes noisy at the same times each day suggests something environmental crossing the sky view.
Obstruction. The map, not just the percentage. Vegetation grows and things get moved, so an installation that was clean at handover can degrade without anyone touching the dish. The obstruction troubleshooting guide covers reading and fixing it.
Alignment. Actuated dishes can re-aim themselves, and very occasionally a firmware update moves one. If performance changed for no visible reason, compare the current tilt, azimuth, and elevation against the desired values. We once caught a dish silently rotate 190° after a firmware update; a reboot put it back.
How do you separate latency problems from throughput problems?
They have different causes and different tests. For latency, the ping matrix tests dozens of real destinations across regions at once, which shows immediately whether high latency is general (a link problem) or specific to one region or service (a routing problem, not yours to fix). What counts as normal is covered in what's a good Starlink ping.
For throughput, browser speed tests measure the whole path including the test server's mood. iPerf measures raw throughput between two machines you control, which makes it the honest tool for "the link is slow" claims, and the diagnostics suite includes an iPerf client alongside traceroute, DNS lookup, and port checks. One caution from experience: public iPerf servers are frequently busy or unreachable, so treat a failed public-server test as inconclusive rather than as evidence. Setting iPerf up on Windows is its own small ordeal, so we wrote it up.
How to install iPerf on Windows →
How does a baseline change the conversation?
If the installation was verified with a recorded session at handover, the fault call starts from evidence: what the dish did on day one, in that exact position. Record a short diagnostic session, export the report, and put the two side by side. Drop rate up where it was zero, obstruction up from 0%, latency unchanged: the comparison usually names the culprit before anyone climbs anything. That baseline workflow is the verification guide.
The short version
Run the two-path ping first: device and router side by side. Clean router side means a LAN problem, and you can show the customer on the spot. Matching degradation on both sides means the dish: read the event log for the pattern, check the obstruction map, then alignment. Use the ping matrix for latency questions and iPerf against a server you control for throughput claims, and diagnose against the handover baseline if one exists.
Part of Starlink for Installers and Professionals. Nexus Telemetry is built by Liquidbinary Ltd, the team behind one of the first Starlink Enterprise management platforms. Pro runs natively on Windows, macOS, and Linux with a free trial.